
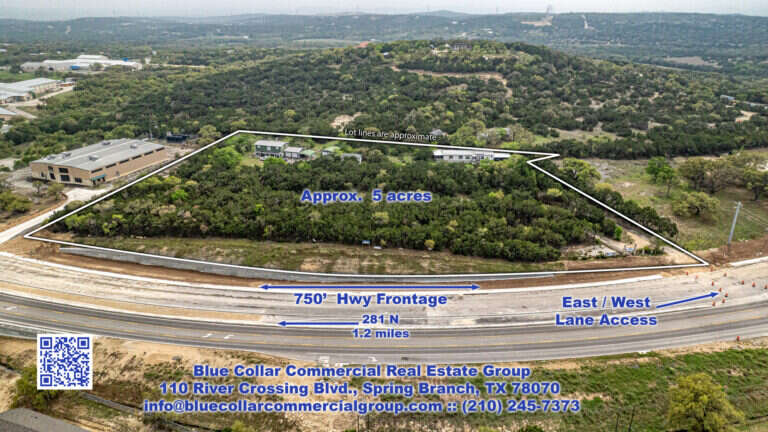
SoldLand
21393 TX-46, Bulverde
Asking price $1,595,000 · Closed June 2026
Hays County’s shopping centers have been nearly full for years. Vacancy hit a ten-year low of 1.3% in Q1 2025. With a batch of new centers opening across the county, it rose to 2.6% in Q3 2026, still tighter than the Austin metro. Rents are rising faster here than almost anywhere else in the metro.
Data through September 30, 2026 · Published October 7, 2026 · By Blue Collar Commercial Group
Source: market data through September 30, 2026.
In the third quarter of 2026, Hays County’s retail market had a vacancy rate of 2.6%, based on market data current through September 30, 2026. That’s up from 1.6% a year earlier, but below the Austin metro rate of 3.6%.
New supply explains the rise. Builders delivered 364,000 square feet of retail in the 12 months through Q3 2026, up 88% from the year before, while tenants filled 218,000.
Hays County is the second-largest retail submarket in the Austin metro, with 13.6 million square feet. Asking rent averaged $2.61 per square foot per month in Q3 2026, about $31.32 a year, up 1.2%. Only one Austin submarket saw faster rent growth.
More is coming: 353,000 square feet was under construction across 20 buildings.

Rex Blackburn, Commercial Director
210-823-3721
This report covers the whole market. Rex can tell you what it means for your property.
Talk to RexFor most of the past decade, Hays County retail space was scarce. Vacancy hit a low of 1.3% in Q1 2025. In Q3 2026, it rose to 2.6% as new centers opened faster than they could fill.
Demand is still healthy. Tenants filled 218,000 more square feet than they emptied in the 12 months through Q3 2026, up from 168,000 the year before.
What it means for you: Tenants have a few more choices than a year ago, mostly in new centers.
| Retail space (SF) | Vacancy | Asking rent ($/SF/mo) | 12-mo net absorption (SF) | Under construction (SF) | |
|---|---|---|---|---|---|
| Hays County | 13.6M | 2.6% | $2.61 | 218,000 | 353,000 |
| Austin metro | 125.7M | 3.6% | $2.63 | 1,896,000 | 3,194,000 |
All figures Q3 2026. Absorption is the 12 months through Q3 2026.
Asking rent averaged $2.61 per square foot per month in Q3 2026, about $31.32 a year, up 1.2% from a year earlier. That’s about the same as the metro average of $2.63, and growing faster. Ten years ago, rent here was $1.81 a month.
What it means for you: Tenants should budget for increases. Owners still have pricing power, though less than in 2023, when rents rose 6.4%.
353,000 square feet of retail was under construction across 20 buildings in Q3 2026, down from 408,000 a year earlier and 739,000 at the Q1 2023 peak. New starts fell 28%.
Investors bought $22.6 million of Hays County retail property with a reported price in the 12 months through Q3 2026, down 20% from the year before. Texas doesn’t require price disclosure, so the true total is higher. The cap rate averaged 6.4%, the highest in ten years of data.
The base-case forecast has vacancy rising a little more as new centers open, then holding steady. It’s 3.2% in Q4 2026, between 3.4% and 3.6% during 2027, and 3.4% in both Q3 2028 and Q1 2031. Asking rent rises from $2.62 per square foot per month in Q4 2026 to $2.93 by Q1 2031.
If things go right: population growth fills the new centers quickly and vacancy stays near today’s level.
If things go wrong: too many centers open at once and lease slowly.
A forecast is not a promise.
Hays County retail is growing up. New centers are adding choices, and vacancy is normalizing from historic lows, but demand and rents are still solid.
Our view: retail tenants should use the new centers as leverage while they’re filling. Investors should favor established, well-anchored centers, which will hold up best as new competition arrives.
Rex Blackburn, Commercial Director
For Buyers
A 6.4% cap rate is the best in ten years of data for Hays County retail.
For Sellers
Well-leased, established centers will draw the most interest.
For Holders
Renew tenants before nearby new centers finish leasing.
Hays County retail tenants have a little more choice in Q3 2026, with 2.6% vacancy and new centers opening. Rents are still rising.
If your lease ends in the next two years, compare your renewal with a new-center offer.
Sales count only sales with a reported price.
In Q3 2026, 2.6% of Hays County’s retail space was vacant, up from 1.6% a year earlier and below the Austin metro rate of 3.6%.
Asking rent averaged $2.61 per square foot per month in Q3 2026, about $31.32 per square foot per year, up 1.2% from a year earlier.
Yes. 353,000 square feet was under construction across 20 buildings in Q3 2026.
This report covers the Q3 2026 Hays County retail market, with data current through September 30, 2026. It uses brokerage market data on inventory, vacancy, asking rents, absorption, construction, leasing and sales, plus that data’s base-case forecast through Q1 2031. Figures are for the Hays County submarket of the Austin market. Sales volume counts only sales with a reported price, because Texas does not require price disclosure.
Data through October 6, 2026
Data through October 6, 2026
Data through October 6, 2026
Land, buildings and businesses we sold for our clients.
Asking price $1,595,000 · Closed June 2026
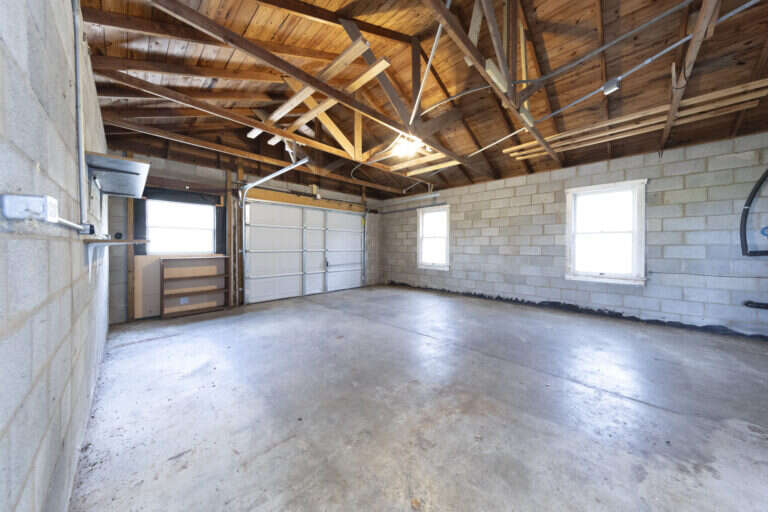
Asking price $1,700,000 · Closed June 2026
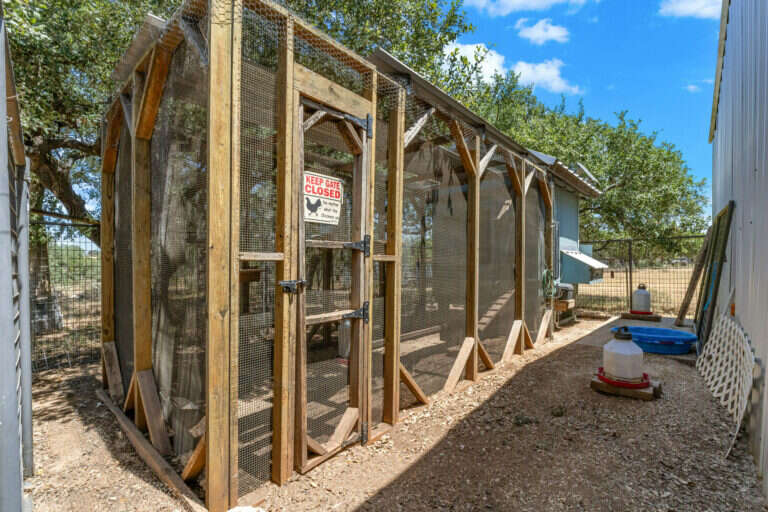
Asking price $1,095,000 · Closed April 2026
Based in New Braunfels. We work the I-35 corridor from San Antonio to Austin and out into the Hill Country. When the deal is farther out, we go there too.
New Braunfels, Bulverde, Canyon Lake, Spring Branch
Seguin, Schertz
San Marcos, Buda, Kyle, Wimberley
San Antonio, Converse, Selma, Stone Oak, Universal City
The Austin metro area
Blanco, Johnson City
Fredericksburg
Boerne
Each guide uses U.S. Census data: people, income and jobs.
What is changing in Texas land, water and growth, explained for owners, not insiders.
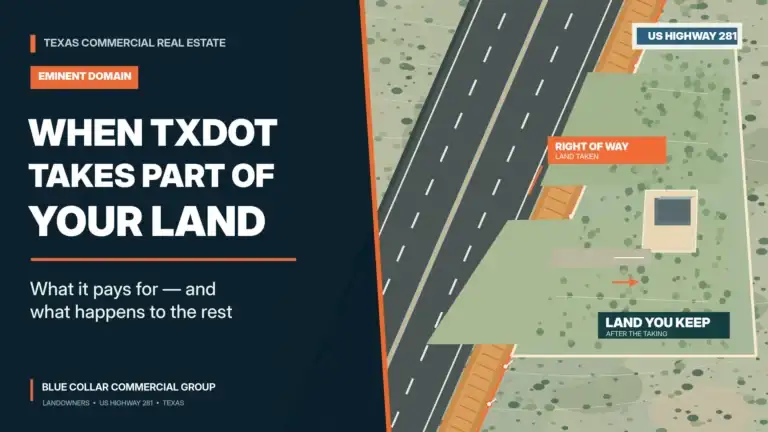
TxDOT taking part of your Texas land? See what the state pays for, which losses it doesn't count, how the process runs, and when…
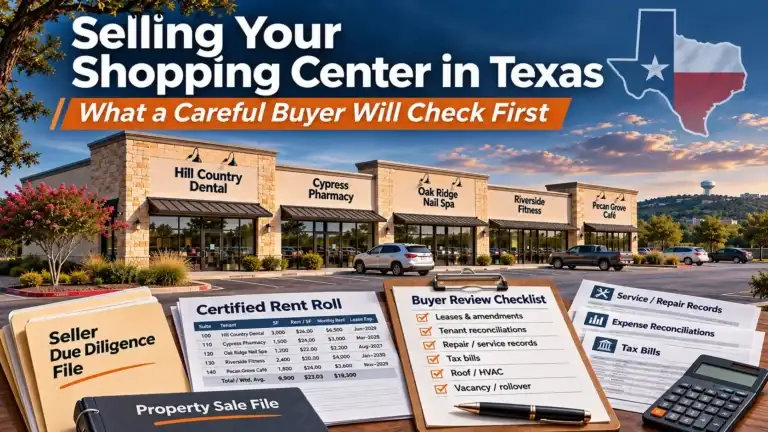
Selling a Texas shopping center? See how a careful buyer rebuilds your income, which fixes can pay off, and how to handle tenant estoppels…
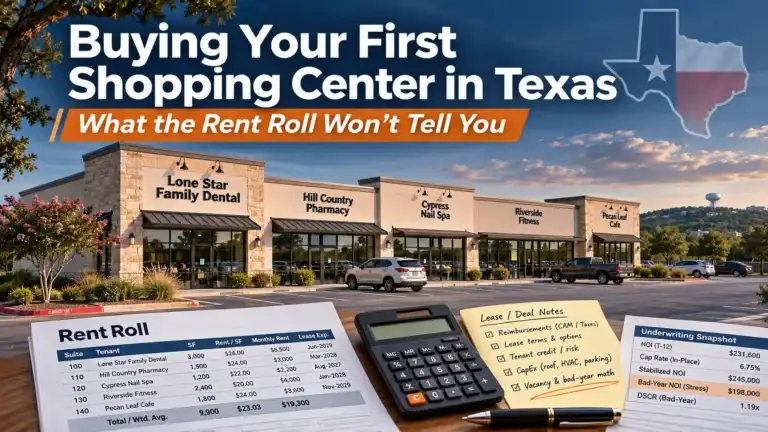
Buying your first Texas shopping center? See how vacancy, taxes and loan terms can turn a 7.5% return into 5%, and what to check…

A 15-minute call. Tell him what you own or what you want to buy. He will tell you what he sees, good and bad. No cost, no pressure.
Talk to Rexor call 210-823-3721
We Are Ready To Help You In Making Smart Real Estate Decisions
Whether you have questions about commercial real estate, need advice on your next investment, or are ready to take the next step, we’re here to help. At Blue Collar Commercial Group of New Braunfels, we pride ourselves on providing personalized, expert guidance at every step. Fill out the contact form, and we’ll get back to you promptly to discuss how we can work together to achieve your goals. Let’s start the conversation today!