
Updated October 2026. This article compares retail space in the San Antonio area, Comal, Guadalupe, Hays and Kendall counties and the Austin area, using brokerage market data through September 30, 2026. It is for investors who might buy a shopping center and for business owners who might lease a storefront between Austin and San Antonio.
What changed in this update
Vacancy is higher than a year earlier in the Austin area, Guadalupe County and Hays County, flat in the San Antonio area and Kendall County, and lower in Comal County. Asking rents rose in all six markets.
The quick answers
- How full is retail space along the corridor? Very full. In September 2026 only about 2.4 to 4.0 percent of retail space was empty in every market we checked.
- Which county is tightest? Comal County, at about 2.4 percent empty. It is also the only one of the corridor counties where vacancy clearly fell over the past year.
- Where did vacancy move the most? Guadalupe and Hays counties. Guadalupe went from about 1.8 to 2.9 percent empty and Hays from about 1.6 to 2.6 percent. The Austin area went from about 3.0 to 3.6 percent.
- Are rents rising? Asking rents rose in every market, from about 0.8 percent in the Austin area to about 4.6 percent in Comal County, over the twelve months to September 2026.
- Is new space being built? Yes, but unevenly. Guadalupe and Kendall counties have the most under construction compared with what they already have. Comal County has the least.
- Does a growing population mean a retail property pays off? Not by itself. Population is rising, but a given center still depends on its tenants, its lease terms, its access and its price.
- What should a buyer check first? The rent roll, the lease type, the end date of each lease, and how customers actually reach the driveway.
What retail space means here
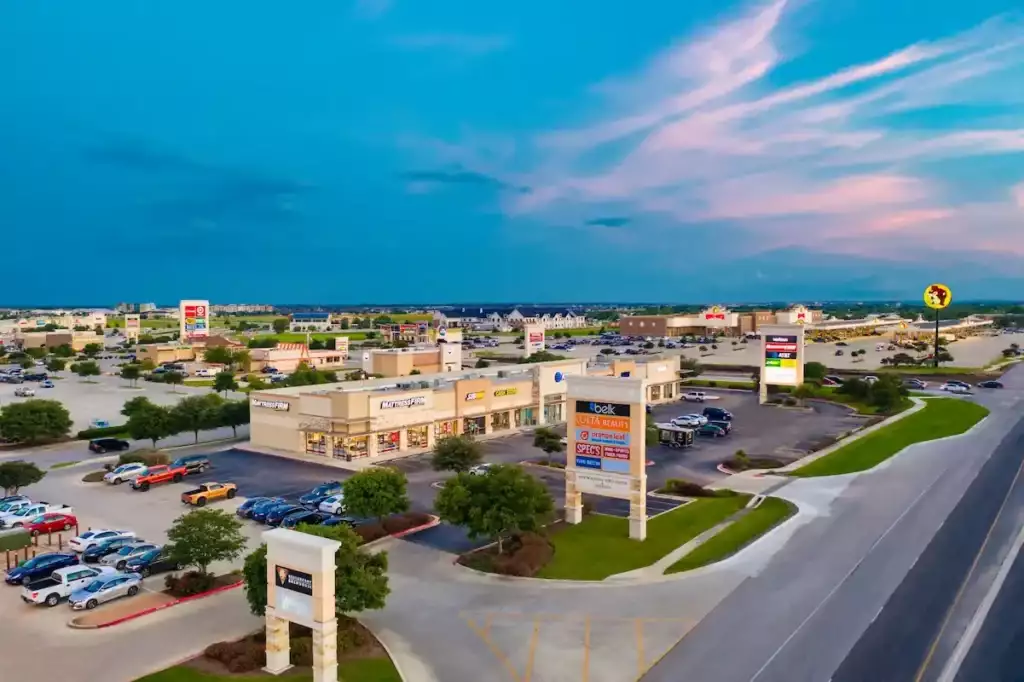
Retail space is any building where a business sells to or serves the public. That covers a grocery-anchored center, a strip of small shops, a pad site with a single restaurant, a bank branch, and a main-street storefront in a county seat. Salons, dentists, tax preparers and urgent care clinics rent retail space too, because their customers walk in off the street.
The corridor between Austin and San Antonio is not one market. It is a string of different ones. San Antonio and Austin are large metros. Comal, Guadalupe, Hays and Kendall counties are smaller, with only a few million square feet of retail each. Kendall County has about 2.7 million square feet in total, while the San Antonio-area figure is about 153.6 million. That difference in size changes how much one building can move the numbers.
A note on labels. The market data groups Comal, Guadalupe and Kendall counties with San Antonio, and Hays County with Austin. “Bexar County” figures in market data are San Antonio-area figures, so we call that row San Antonio. Each market has its own report, linked in the tables and again later.
What it means for you. When you read a vacancy number, ask how big the pool is. Two percent of a small county is a handful of buildings.
The county-by-county numbers
This table puts the six markets side by side. Vacancy is the share of space that is empty. Asking rent is what landlords are asking, not what tenants have signed. The data lists rent per square foot per month, so we also show it per year, which is how many leases are written.
| Market | Empty, Sept. 2025 | Empty, Sept. 2026 | Asking rent per sq ft, per month | Per year | Rent change, 12 months |
|---|---|---|---|---|---|
| San Antonio area | 4.0% | 4.0% | $2.02 | about $24.24 | 3.7% |
| Comal County | 2.6% | 2.4% | $2.11 | about $25.32 | 4.6% |
| Guadalupe County | 1.8% | 2.9% | $1.90 | about $22.80 | 4.4% |
| Kendall County | 2.9% | 2.9% | $2.05 | about $24.60 | 4.0% |
| Hays County | 1.6% | 2.6% | $2.61 | about $31.32 | 1.2% |
| Austin area | 3.0% | 3.6% | $2.63 | about $31.56 | 0.8% |
Brokerage market data through September 30, 2026. Percentages and dollar figures are rounded. Annual rent is the monthly figure times 12.
The next table looks at new space. “Under construction” is retail space being built right now. “Opened in 12 months” is space that finished in the year to September 2026. We also show space under construction as a share of the retail space that already exists, because a large number means more in a small county than in a large one.
| Market | Under construction, Sept. 2026 (sq ft) | Same, Sept. 2025 | Opened in 12 months (sq ft) | Under construction as a share of existing space |
|---|---|---|---|---|
| San Antonio area | about 1.09 million | about 1.32 million | about 1.20 million | about 0.7% |
| Comal County | about 69,000 | about 257,000 | about 295,000 | about 0.6% |
| Guadalupe County | about 239,000 | about 220,000 | about 236,000 | about 3.2% |
| Kendall County | about 90,000 | about 81,000 | about 31,000 | about 3.3% |
| Hays County | about 353,000 | about 408,000 | about 364,000 | about 2.6% |
| Austin area | about 3.19 million | about 3.01 million | about 2.67 million | about 2.5% |
Brokerage market data through September 30, 2026. The last column is space under construction divided by total retail space in that market.
A third measure investors often see is the cap rate. It is a property’s yearly net income divided by its price, shown as a percent. A higher cap rate means more income for each dollar of price, but it often reflects more risk or a weaker location, so it is not a score. Average cap rates in the data for September 2026 were about 6.3 percent in Comal County, 6.4 percent in Kendall and Hays counties, 6.5 percent in the San Antonio and Austin areas, and 6.8 percent in Guadalupe County. These are market averages, not a price for any building you may be looking at.
What it means for you. No single column tells the story. Read vacancy, rent change and new space together, then look at the specific center you care about.
What each county’s numbers say
Comal County
Comal County had the lowest vacancy of the group in September 2026, about 2.4 percent, down slightly from a year earlier. It also had the fastest rent growth in the table, about 4.6 percent, with asking rent at about $2.11 per square foot per month, or $25.32 per year. The Comal County page has more on the area.
The construction picture is quiet. About 69,000 square feet was being built, down from about 257,000 a year earlier. About 295,000 square feet opened over the past twelve months. So new space arrived, and the county still ended the period with a little less empty space than before.
Comal County also had the fastest population growth in the group in the Census estimate for the year to July 2025, at about 3.8 percent. Population is one input for retailers. It does not tell you which corner or which center will do well.
What it means for you. Tenants have few vacant spaces to pick from. Check each lease closely.
Guadalupe County
Guadalupe County shows the biggest swing. About 1.8 percent of retail space was empty in September 2025. A year later it was about 2.9 percent. That is still a low number, but it moved the opposite way from Comal County. About 236,000 square feet opened in the past twelve months, compared with about 80,000 in the twelve months before. Another 239,000 square feet was under construction, about 3.2 percent of what is already there.
Asking rent is the lowest in the group at about $1.90 per square foot per month, or $22.80 per year, and it still rose about 4.4 percent. The average cap rate is the highest in the group at about 6.8 percent. Seguin and Schertz are two of the towns on our Guadalupe County page.
What it means for you. A vacancy rise from a very low base is not a warning sign by itself. It does show that new buildings opened faster than tenants moved in over this period. For a buyer, the lease-up status of any newer center is worth a direct question.
Hays County
Hays County is the Austin-side county in this group. Vacancy rose from about 1.6 percent to about 2.6 percent. Asking rent is about $2.61 per month, or $31.32 per year, close to the Austin-area figure, and it rose about 1.2 percent in twelve months, the slower end of the group. About 364,000 square feet opened in the past year, up from about 194,000 the year before, and about 353,000 square feet was still being built.
The towns on our list include Kyle, Buda, San Marcos and Wimberley. Towns in one county can differ a lot, so a county average hides detail. See the Hays County page for more.
The county’s population grew about 3.4 percent in the year to July 2025, the second-fastest of the four corridor counties.
What it means for you. Hays County rents are closer to Austin levels than to the rest of the corridor. Ask what a tenant would pay for similar space in the next town over before you accept an asking rent.
Kendall County
Kendall County is small. Its retail inventory is about 2.7 million square feet. Vacancy was about 2.9 percent in September 2026, almost the same as a year earlier. Rent rose about 4.0 percent to about $2.05 per month, or $24.60 per year. Under construction was about 90,000 square feet, about 3.3 percent of existing space, the highest share in the group. Only about 31,000 square feet opened in the last twelve months.
At this size, one center can change the percentages. A single 27,000 square foot building is roughly one percentage point of vacancy in this county. Boerne is one of the main towns, and the Kendall County page has more.
What it means for you. Treat Kendall County percentages as a rough guide. A buyer should look at the actual rent roll instead of leaning on the county average.
San Antonio and Austin
The San Antonio area had about 4.0 percent of retail space empty in September 2026, about the same as a year earlier. Asking rent was about $2.02 per square foot per month and rose about 3.7 percent. Space under construction fell from about 1.32 million to about 1.09 million square feet.
The Austin area had about 3.6 percent empty, up from about 3.0 percent. Rent was about $2.63 per month and rose about 0.8 percent, the slowest of the six. About 3.19 million square feet was under construction, up from about 3.01 million, and about 2.67 million opened over the past twelve months, compared with about 1.65 million in the twelve months before.
Both are metro-wide figures. A single neighborhood can differ a lot from the metro average. For location pages, see San Antonio and Austin.
What it means for you. The big metros have more supply and more choices. The smaller counties have fewer buildings and less margin.
Why small-town retail runs so tight
Three facts about the data explain why the smaller counties show vacancy below three percent.
- The inventory is small. Comal County has about 10.9 million square feet and Kendall County about 2.7 million. A handful of buildings make up the market.
- Averages mix old and new. Main-street buildings, older strip centers and newer centers share one number. Some of the space may not suit what a modern tenant wants, so the choices a tenant really has can be fewer than the average suggests.
- Little new space is underway in some places. Comal County has about 0.6 percent of its retail space under construction. Fewer new buildings mean fewer new choices.
Low vacancy does not tell you a rent is fair. It does tell you that a tenant may have to take what is available, and that a landlord with a vacant space may get several calls. Both are facts about this moment. Neither is a promise about next year.
The market data also carries one baseline outlook for each market. For Comal County it shows vacancy near 2.3 percent at the end of 2026. For Kendall and Hays counties it shows about 3.2 percent. A baseline outlook is one scenario from a model. It is not a prediction, and nobody should price a purchase on it.
What it means for you. If you are a retailer, start your search early and keep a backup option. If you are a buyer, remember that a tight market can loosen when a few tenants leave.
New centers and new households
Retail centers are generally planned where a developer and a tenant believe there are enough households and enough traffic. That is a general observation about how shopping centers get built. It is not a claim about any specific center in this corridor, and we do not list projects here because we have not confirmed them.
Each county opened more than the year before (see the table above). Population grew in all four counties in the year to July 2025, from about 2.5 percent in Kendall County to about 3.8 percent in Comal County, according to the Census Bureau. Texas as a whole grew about 1.2 percent.
Those facts sit side by side. We cannot say from this data that one caused the other, and a buyer should not assume it. Some new buildings fill quickly. Some take longer than planned. A center near new homes can still struggle if its tenants do not match the neighbors or if access is poor.
What it means for you. Ask who the target customers are and how many live within a short drive. Then ask whether the stores already open in the center are drawing from them.
Lease types: what the tenant pays
Two retail spaces with the same rent per square foot can cost a tenant very different amounts. The difference is the lease type.
- Triple net (NNN). The tenant pays base rent plus a share of the property taxes, insurance and common-area upkeep. The landlord’s income is more predictable, and the tenant’s monthly cost is higher than the base rent alone.
- Modified gross. The tenant pays one rent that covers some of those costs and pays the rest separately. The lease spells out which ones.
- Full service or gross. The tenant pays one rent and the landlord covers the costs. This is rarer in retail than in office.
Retail space is often leased on a triple net basis, but read the lease instead of assuming. The asking rents in this article are base numbers. On a triple net lease, the tenant pays more on top. Ask for the estimated extra charges per square foot per year, and ask what they were for each of the last three years.
Other terms matter too. How long is the lease? Are there options to renew, and at what rent? How much does rent step up each year? Who pays for the roof and the parking lot? Who pays to remodel the space for a new tenant? Our glossary entry on asking rent explains the gap between what a landlord asks and what a tenant signs.
What it means for you. Compare spaces by total cost per year, not by base rent. Have a lawyer review any lease before you sign.
What a buyer checks before buying a retail property
Buying a shopping center or a small retail building is buying a stream of rent from other businesses. These are the things a careful buyer looks at.
Tenant mix
List every tenant and what it sells. A center with a grocer, a pharmacy and a few services tends to draw people for daily needs. A center with several restaurants or specialty shops may depend more on the economy and on foot traffic. Look at how much of the rent comes from the largest tenant. If one tenant pays a large share and leaves, the loss is large.
Lease terms and end dates
Make a table of when each lease ends. If many end in the same year, the owner could face a lot of vacancy at once. Ask for copies of each lease, not a summary. Look for early termination rights, unpaid or reduced rent, and any promises the landlord made.
Co-tenancy
Some leases say that if a named tenant leaves, or if the center falls below a certain occupancy, the remaining tenants can pay less rent or leave. That clause is called co-tenancy. A buyer needs to find it before closing, because it can turn one departure into several. For more on how a main tenant affects the rest of a center, see our article on anchor tenants.
Traffic and access
Visit the property at a few different times, including a weekday afternoon and a weekend. Watch how customers get in and out. Can they turn left into the driveway? Is there a signal nearby? Can a delivery truck turn around? A good building with hard access is a weaker building than it looks on paper.
Road projects
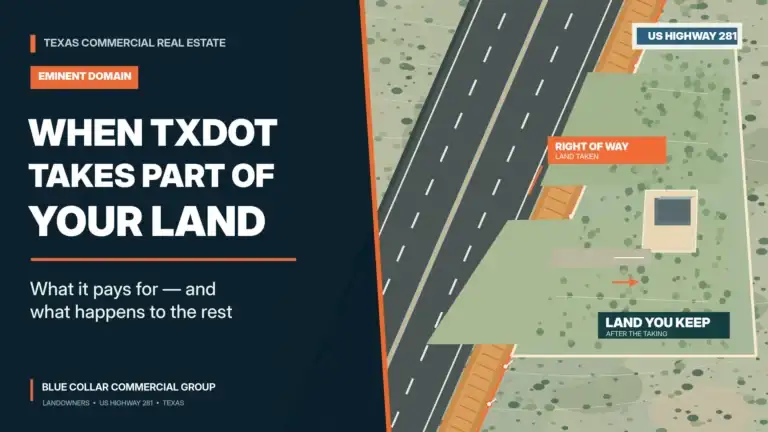
A highway project can help a property or hurt it. A raised median can stop left turns into a driveway. Ramp changes can move an exit away from your door. Land taken for a wider road can remove parking. Our article on Highway 281 construction sorts the projects by how far along they are. As of October 11, 2026, it reports that the state’s plan for 281 between the Comal County line and Highway 46 is a freeway of about 6.7 miles with six main lanes, and that work on Highway 46 at 281 was in its final stage. Planned projects can change, so check with the Texas Department of Transportation before you rely on a date or a design. Our article on road construction and property value in New Braunfels covers what owners should ask.
Price and rent against the market
Compare the rent in each lease with the asking rents in the tables above. If tenants pay well below the asking rent for similar space, the owner might be able to raise rents when leases end, or the tenant might leave for a better deal. If they pay above it, the reverse can happen. Ask your lender how they view the numbers too.
What it means for you. Start with the rent roll and the leases. A good county average will not rescue a center with weak tenants and short leases.
What a business owner checks before leasing
If you plan to open or move a shop, the questions are similar, but your risk is different. You are not buying the building. You are committing your business to a location for years.
- What is the total yearly cost? Add base rent, the triple net charges, utilities and your own remodel costs. Divide by the square feet you need.
- What can the landlord do? Ask whether the landlord can move your space, add a competing tenant that sells what you sell, or change the parking.
- What is the exit? If the business fails, find out what you owe. Some leases make the owner personally responsible for the rent if the business closes. A lawyer should read that clause.
Do not let a short supply rush you past the lease. If a landlord will not answer basic questions before signing, that is useful information.
Risks to weigh
Population is rising and rents rose in every market in the table. There are still real risks, and a fair look names them.
- Financing costs. The 10-year Treasury par yield, which many lenders use as a reference point, was 5.24 percent on October 9, 2026, according to Treasury data. One certified development company posted an SBA 504 rate of 6.97 percent for 20- and 25-year terms on October 8, 2026. That rate applies only to the SBA portion of a loan, not to the blended cost of the whole loan. Ask your lender for the full terms.
- More supply in some places. Vacancy rose in the Austin area, Guadalupe County and Hays County while new space opened. If more space opens than tenants take, owners may offer concessions.
- Averages hide differences. A county average cannot tell you whether a specific center is full, tired, well placed or poorly placed.
What it means for you. Run your numbers with higher vacancy, lower rent and higher interest than today’s. If the property still works, you have some room. If it does not, you learned that before closing.
Common questions
Is retail in this corridor a good investment?
That depends on the property, the price, the leases and your goals. The market data shows low vacancy and rising asking rents as of September 2026, but it cannot say how any one building will do. Talk to a lender, a CPA and a lawyer about your own case.
Why is Comal County so tight?
The data shows about 2.4 percent of space empty, a small amount of space under construction and a growing population. We cannot point to one cause. Smaller markets also have fewer buildings, which keeps the percentages low.
Vacancy rose in Hays and Guadalupe counties. Should I worry?
It is worth asking about. Both counties moved from very low vacancy to still-low vacancy while new space opened. Ask the owner of any newer center how much of it is leased and for how long.
What does triple net mean?
The tenant pays rent plus a share of taxes, insurance and common-area upkeep, so total cost is higher than base rent.
Does a new highway raise the value of a retail property?
Not automatically. It can change traffic, driveways and access. Read the plan for your corner.
Where can I see the full numbers?
Each market has a report with the full set of figures. Start with Comal County, Guadalupe County, Hays County or Kendall County. For our retail services, see retail for buyers and retail for tenants.
The bottom line
As of September 2026, retail space between Austin and San Antonio is tight. Vacancy ranges from about 2.4 percent in Comal County to about 4.0 percent in the San Antonio area, and asking rents rose in every market. The details are less uniform. Comal County got a little tighter. Guadalupe and Hays counties got looser from very low levels. Kendall County barely moved but is small enough that one building matters.
At Blue Collar Commercial Group, we help owners, investors and business owners work through retail space across the Texas Hill Country and the San Antonio to Austin corridor. Contact our team to talk it through.
First published July 2025. Rewritten October 2026. Market figures come from brokerage market data through September 30, 2026. Population figures come from the U.S. Census Bureau, rates from U.S. Treasury data and a lender’s published rate sheet, and road facts from Texas Department of Transportation information as of October 11, 2026. This article is general information. It is not investment, legal, tax or financial advice.